
Bulls sound like they're crying wolf (artigo do Kilgore)
1 Mensagem
|Página 1 de 1
Bulls sound like they're crying wolf (artigo do Kilgore)
Bulls cry 'wolf'
Bears have the edge in this market standoff, writes Tomi Kilgore.
Bulls sound like they're crying wolf
Commentary: Bears have the edge in standoff with bulls
By Tomi Kilgore, CBS.MarketWatch.com
Last Update: 12:01 AM ET May 24, 2004
NEW YORK (CBS.MW) -- What goes down doesn't have to bounce back up.
Stability can look and feel safe, especially after the market spent the past few months testing lower levels. But not if it lasts too long.
After a pretty rough start to May, the stock market has remained in a relatively narrow range the past couple of weeks.
On the surface, that seems to be a good thing, as congestion at these lower levels is giving some the impression that a base is building for a bottom. Below the surface, however, things are starting to look a bit dodgy.
Crude prices are easing from their highs, bond yields appear to have begun a correction, and the U.S. dollar seems ready to resume its long-term downtrend.
Technically speaking, the candlestick chart of the "Diamonds" (DIA) -- a tracking stock for the Dow industrials ($INDU) -- is littered with reversal patterns.
Have you ever heard the story about the boy who cried "wolf?" (Perhaps "bull," in more ways than one, is a better word.)
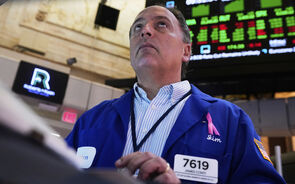
The Dow rallied as much as 99 points in intraday trading on Friday to "peak" above 10,000, but backed off to close up just 29 points at 9,967. The Dow was down just 46 points on the week, but closed below the 10,000 mark every session despite making intraday forays above it on three of those days.
For all the reasons for stocks to take a shot at the upside, bulls still haven't followed through. At least not enough to make a dent in the intermediate-term downtrend, or to do battle with even close resistance.
When it comes to money, it's always better to bet on results than potential. And so far, it's still the bears that have had the best results.
Wall Street standoff
Bulls might look at the chart of the "Diamonds" and see a bottoming sign. Bears, however, might see something completely different.
One of the market's characteristics the past couple of weeks has been the lack of volume. That has been attributed as much to a dearth of buying as to a scarcity of selling.
This can be interpreted as a positive for the market, since the lack of interest by sellers might suggest stocks have overshot their downside target, and it wouldn't take much to get it moving back to the upside.
Meanwhile, bears have been waiting patiently at resistance for the market to come to them, but the lack of buying hasn't provided them with any rallies to sell into.
It has become a waiting game; an old fashioned Wall Street standoff. Which side will be able to hold out longer?
Last week, I wrote about the apparent lack of fear among sellers (no short-covering) despite a number of bullish technical signals.
It's always easier on an investor/trader's stomach to hold onto a position that is in the money, no matter how slightly, than one that is either at or out of the money.
Simply put, bulls are more likely to be waiting for an averaged-down position to breakeven or to have a cushion on a new position, while bears are more likely waiting to add to a winning position.
Since the market is trading near the bottom of its recent range, and still below resistance, rather than near the top of its range, bears still have the upper hand.
It's like poker when the last two in a hand are raising against each other; the one with the best cards showing, or with the biggest pile of chips in front of them, has the psychological advantage.
A vulnerable market
Over the three sessions from May 6 to May 10, the "Diamonds" tumbled $3.55, or 3.4 percent. They have flattened out a bit since, but notice all the small "bodies" lying around.
In candlestick charting, a session's "body" is the difference between the open and closing prices.
Small "bodies" are called "spinning tops," and suggest the market is undecided (when there is no body, like on May 17, it is referred to as a "doji").
Typically, when several "spinning tops" -- especially when they appear in the middle of a wide intraday range -- or a "doji" appear at the extreme of a move, they suggest a trend is about to change. A strong upward move would confirm the bullish signals.
But given that the bulls have not been able to use these signals to take out even close resistance at the "gap" between the May 7 low ($101.15) and the May 10 high ($101.00), means something might be wrong.
The "Diamond" did surge as much as $1.43 to $101.40 in intraday trading on May 19, but it succumbed to a late-day sell-off to close down 27 cents at $99.70; the "gap" remains resistance until it is filled on a closing basis.
The market has now become vulnerable to a quick, hard strike by the bears. Another downside "gap," or a large downside "body," would likely unleash a flood of selling, as buyers give up hope of breaking even and sellers give up waiting to sell on rallies.
Continued sharp pullbacks in crude and bond yields could change the outlook, but you don't want to bet too heavily on help from others. And bulls might have showed one too many reversal signals without coming through to get any help.
Bears have the edge in this market standoff, writes Tomi Kilgore.
Bulls sound like they're crying wolf
Commentary: Bears have the edge in standoff with bulls
By Tomi Kilgore, CBS.MarketWatch.com
Last Update: 12:01 AM ET May 24, 2004
NEW YORK (CBS.MW) -- What goes down doesn't have to bounce back up.
Stability can look and feel safe, especially after the market spent the past few months testing lower levels. But not if it lasts too long.
After a pretty rough start to May, the stock market has remained in a relatively narrow range the past couple of weeks.
On the surface, that seems to be a good thing, as congestion at these lower levels is giving some the impression that a base is building for a bottom. Below the surface, however, things are starting to look a bit dodgy.
Crude prices are easing from their highs, bond yields appear to have begun a correction, and the U.S. dollar seems ready to resume its long-term downtrend.
Technically speaking, the candlestick chart of the "Diamonds" (DIA) -- a tracking stock for the Dow industrials ($INDU) -- is littered with reversal patterns.
Have you ever heard the story about the boy who cried "wolf?" (Perhaps "bull," in more ways than one, is a better word.)
The Dow rallied as much as 99 points in intraday trading on Friday to "peak" above 10,000, but backed off to close up just 29 points at 9,967. The Dow was down just 46 points on the week, but closed below the 10,000 mark every session despite making intraday forays above it on three of those days.
For all the reasons for stocks to take a shot at the upside, bulls still haven't followed through. At least not enough to make a dent in the intermediate-term downtrend, or to do battle with even close resistance.
When it comes to money, it's always better to bet on results than potential. And so far, it's still the bears that have had the best results.
Wall Street standoff
Bulls might look at the chart of the "Diamonds" and see a bottoming sign. Bears, however, might see something completely different.
One of the market's characteristics the past couple of weeks has been the lack of volume. That has been attributed as much to a dearth of buying as to a scarcity of selling.
This can be interpreted as a positive for the market, since the lack of interest by sellers might suggest stocks have overshot their downside target, and it wouldn't take much to get it moving back to the upside.
Meanwhile, bears have been waiting patiently at resistance for the market to come to them, but the lack of buying hasn't provided them with any rallies to sell into.
It has become a waiting game; an old fashioned Wall Street standoff. Which side will be able to hold out longer?
Last week, I wrote about the apparent lack of fear among sellers (no short-covering) despite a number of bullish technical signals.
It's always easier on an investor/trader's stomach to hold onto a position that is in the money, no matter how slightly, than one that is either at or out of the money.
Simply put, bulls are more likely to be waiting for an averaged-down position to breakeven or to have a cushion on a new position, while bears are more likely waiting to add to a winning position.
Since the market is trading near the bottom of its recent range, and still below resistance, rather than near the top of its range, bears still have the upper hand.
It's like poker when the last two in a hand are raising against each other; the one with the best cards showing, or with the biggest pile of chips in front of them, has the psychological advantage.
A vulnerable market
Over the three sessions from May 6 to May 10, the "Diamonds" tumbled $3.55, or 3.4 percent. They have flattened out a bit since, but notice all the small "bodies" lying around.
In candlestick charting, a session's "body" is the difference between the open and closing prices.
Small "bodies" are called "spinning tops," and suggest the market is undecided (when there is no body, like on May 17, it is referred to as a "doji").
Typically, when several "spinning tops" -- especially when they appear in the middle of a wide intraday range -- or a "doji" appear at the extreme of a move, they suggest a trend is about to change. A strong upward move would confirm the bullish signals.
But given that the bulls have not been able to use these signals to take out even close resistance at the "gap" between the May 7 low ($101.15) and the May 10 high ($101.00), means something might be wrong.
The "Diamond" did surge as much as $1.43 to $101.40 in intraday trading on May 19, but it succumbed to a late-day sell-off to close down 27 cents at $99.70; the "gap" remains resistance until it is filled on a closing basis.
The market has now become vulnerable to a quick, hard strike by the bears. Another downside "gap," or a large downside "body," would likely unleash a flood of selling, as buyers give up hope of breaking even and sellers give up waiting to sell on rallies.
Continued sharp pullbacks in crude and bond yields could change the outlook, but you don't want to bet too heavily on help from others. And bulls might have showed one too many reversal signals without coming through to get any help.
-
Info.
1 Mensagem
|Página 1 de 1